WEB ANALYTICS
How to build Custom report and Dashboards with Looker Studio
November 8, 2023 • 7 Min Read
How to build Custom report and Dashboards with Looker Studio
Google’s Looker Studio can turns your data into informative reports and dashboards that are easy to read, easy to share, and fully custom.
In the realm of data-driven decision-making, Google’s Looker Studio is the key to unlocking the power of your data. Imagine turning raw numbers into visually stunning reports and dashboards that not only tell a story but also adapt to your unique needs. In this article, we’ll guide you through this transformation, revealing how Looker Studio empowers you to create custom reports and dashboards that are easy to read, share, and fully tailored to your data narrative. Get ready to embark on a data-driven adventure where insights become your compass, and your data tells a captivating story through the art of Looker Studio.
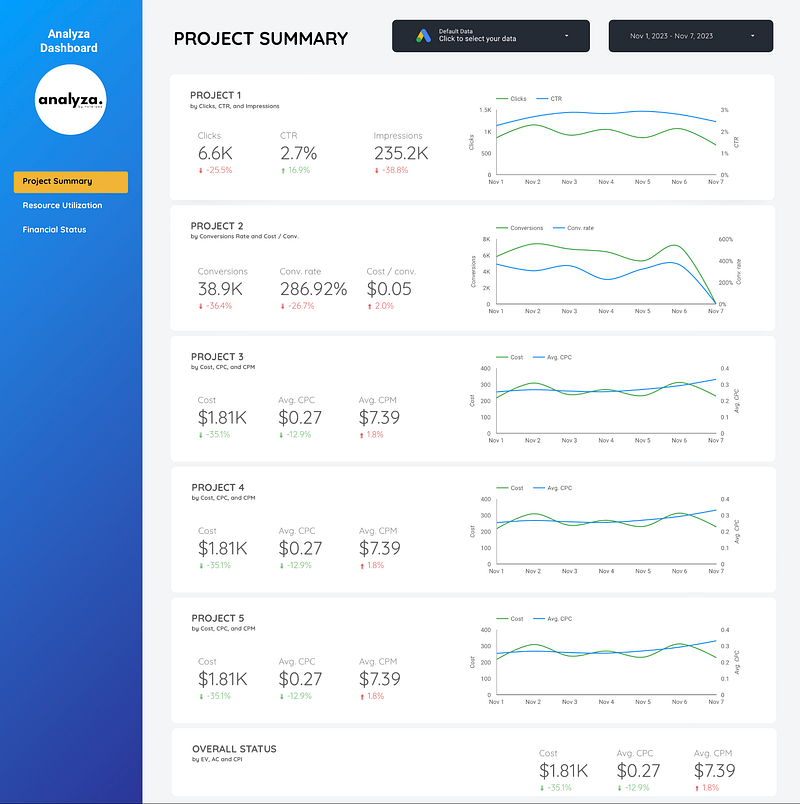
Demo Dashboard for Analyza
Whether you’re a fledgling startup or a well-established corporation, Looker, and Looker Studio (formerly known as Google Data Studio), have the capacity to unlock the true value of your data. This article will delve into the array of features and functionalities they offer, provide a comprehensive guide for their most effective utilization, and shed light on the benefits of data analytics and visualization. To illustrate their real-world significance and answer prevalent questions, we’ll showcase practical case studies.
What is Looker? (formerly Google Data Studio)
Looker Studio is a sophisticated data analytics and visualization solution that empowers businesses to make informed, data-driven decisions. Its intuitive dashboard streamlines data navigation and analysis, and its cloud-based nature ensures accessibility on the go.
One of Looker Studio’s distinguishing features is its dashboard customization, offering a wide array of visual elements such as charts and graphs to craft engaging, interactive reports. It unravels insights into your operations, customer behaviors, and prevailing market trends.
Across diverse domains such as sales, marketing, finance, and HR, Looker Studio proves to be an invaluable ally. It helps identify trends, streamline processes, and boost revenue generation. With its robust data capabilities and analytical tools, Looker Studio is a strategic asset that can revolutionize your business planning efforts.
Exploring the Looker Studio Dashboard
Upon logging into Looker Studio, you’re introduced to a dynamic dashboard that adapts to each user’s preferences, ensuring a personalized experience. The common elements found within the dashboard typically include:
- Data Fields: Lists that help filter and scrutinize data.
- Filters: Functions that allow data refinement based on specific parameters.
- Visualizations: Graphical representations that breathe life into your data.
- Reports and Dashboards: Tailored views of data for gaining insights and effortless sharing.
These elements combine to provide a deeper understanding of your data, empowering you to make well-informed decisions. The Looker Studio dashboard simplifies the exploration of intricate data sets, unveiling hidden patterns and insights that might not be immediately evident. To embark on your Looker Studio journey, all you need is a data source and a thirst for knowledge.

How to Use Looker
Looker is a powerful tool for data analytics and visualization, but it can take some time to get used to. If you’re new to Looker, follow these steps to start using it effectively:
- Get familiar with the Looker interface: Initially, acquaint yourself with the Looker platform to navigate and utilize its offerings, including report and dashboard creation.
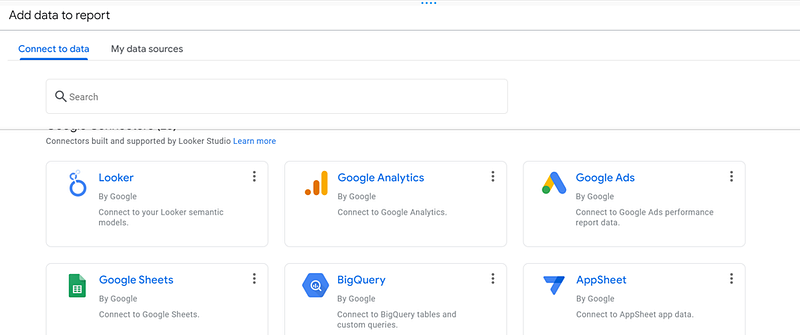
- Connect your data sources: Looker supports various data sources like data warehouses and databases. Typically, Google BigQuery is used by Google Cloud users to store marketing and sales data. Connect your data source to Looker to begin data analysis.
- Create reports: With your data source linked, craft customizable reports in Looker to reveal trends and patterns, facilitating insightful data interpretation.
- Build dashboards: Dashboards are collections of reports and visualizations that provide an overview of your data. With Looker, you can build custom dashboards that give you a real-time view of your business performance.
- Analyze your data: Looker provides powerful tools for data analysis, including the ability to drill down into your data to see more detailed information. Spend some time exploring your data in Looker to uncover insights that can help your business.
Best Practices for Using Looker
To get the most out of Looker, keep these best practices in mind:
- Define clear metrics: Before you start using Looker, make sure you know what metrics you want to track and how you want to measure them. This will make creating reports and dashboards that provide meaningful insights easier.
- Collaborate with your team: Utilize Looker’s sharing features to work collaboratively with your team on data-driven decision-making.
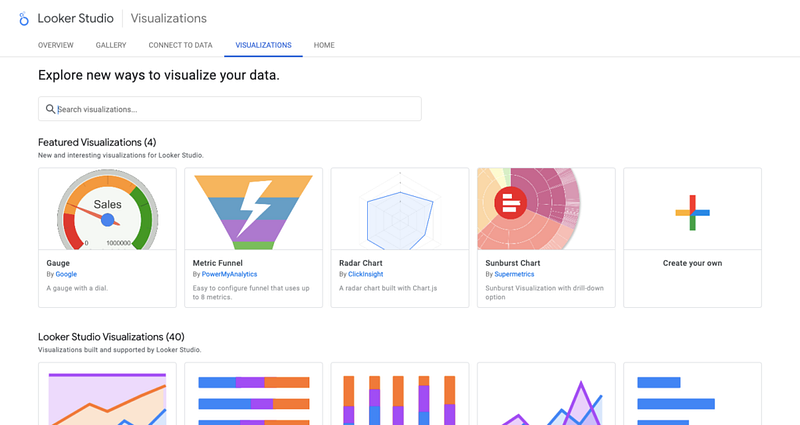
- Experiment with different visualizations: Explore Looker’s diverse visualization tools, like bar charts and heat maps, to discover the most effective presentations for your data.

Sample image collected from Internet
Data Visualization with Looker Studio
Looker Studio provides businesses with powerful data visualization tools that enable them to create compelling visualizations to communicate complex data in a clear and compelling way.
With Looker Studio, you can create customized dashboards that allow you to visualize your data in a way that fits your needs best. The platform has several visualization options, including line charts, bar charts, and scatter plots.
The platform’s user-friendly interface aids in crafting dynamic visualizations, complete with interactive elements for detailed data exploration. Moreover, Looker Studio enables brand alignment in visualizations, with customization options for color and fonts to match corporate styling.
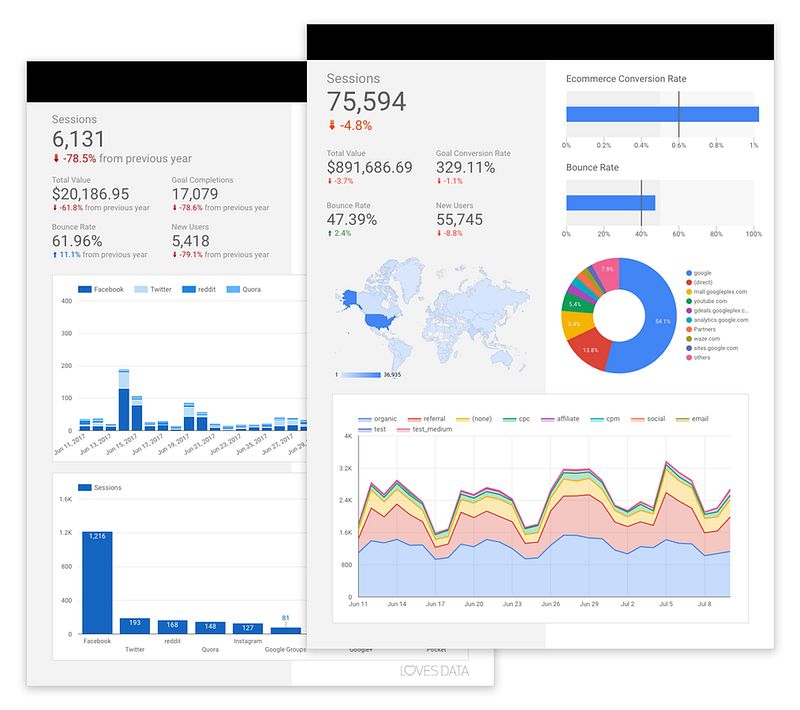
Just don’t forget to collect the raw marketing data first and prepare it for being visualized in Looker Studio.

Image Courtesy: GeeksforGeeks
Looker Studio transforms raw data into discernible patterns and trends, facilitating strategic decision-making through its visualization tools. A key benefit of Looker Studio is its broad integration with various data sources, including databases and cloud services, streamlining data consolidation, and crucial trend analysis.
Customizing Visualizations
The no-code, drag-and-drop interface of Looker makes custom visualization creation accessible. This flexibility extends to crafting personalized dashboards that display essential metrics and insights.
In summary, Looker Studio equips businesses with the capabilities to customize and comprehend their data through visualizations, leading to well-informed business decisions.
Learn why to use Looker Studio?
- Save Time and Resources
Looker Studio helps conserve time and resources, providing a straightforward platform for data analysis and visualization. This efficiency allows businesses to allocate their attention to pivotal tasks like product development and enhancing customer service.
- Better Decision-Making
Looker Studio’s visualization prowess empowers businesses with the insights needed for enhanced decision-making. Customizable reports and dashboards deliver real-time insights for proactive strategy adjustments, fostering growth and improved profitability.
- Visualize Complex Data
Looker Studio excels in making complex data understandable, with visualizations that illuminate patterns and opportunities that may otherwise remain unnoticed, thereby informing more nuanced strategies.
- Increased Efficiency
Looker Studio elevate business efficiency by automating data analysis and visualization processes. This automation cuts down on the time and resources needed to derive insights and make data-driven decisions. The result is enhanced productivity, boosted profitability, and a more efficient workflow.
Case Studies
Successfully incorporated a few companies data visualization with Looker Studio to improve their data analytics and visualization capabilities. Here are a few examples:
Company: A renowned E-CommerceIndustry: E-Commerce Challenge: Difficulty in data presentation to the CXO level Results: Increased efficiency and accuracy in reporting, leading to better decision-making from the CXO level
As we draw the curtains on this data-driven adventure, remember that Looker and Looker Studio are not just tools but storytellers of your data’s potential. In a world where data rules, they empower you to paint a compelling future. Your data is a story waiting to be told, and with Looker Studio, it becomes a tale of limitless possibilities. Embrace them, and let your data lead you to a future filled with boundless horizons.